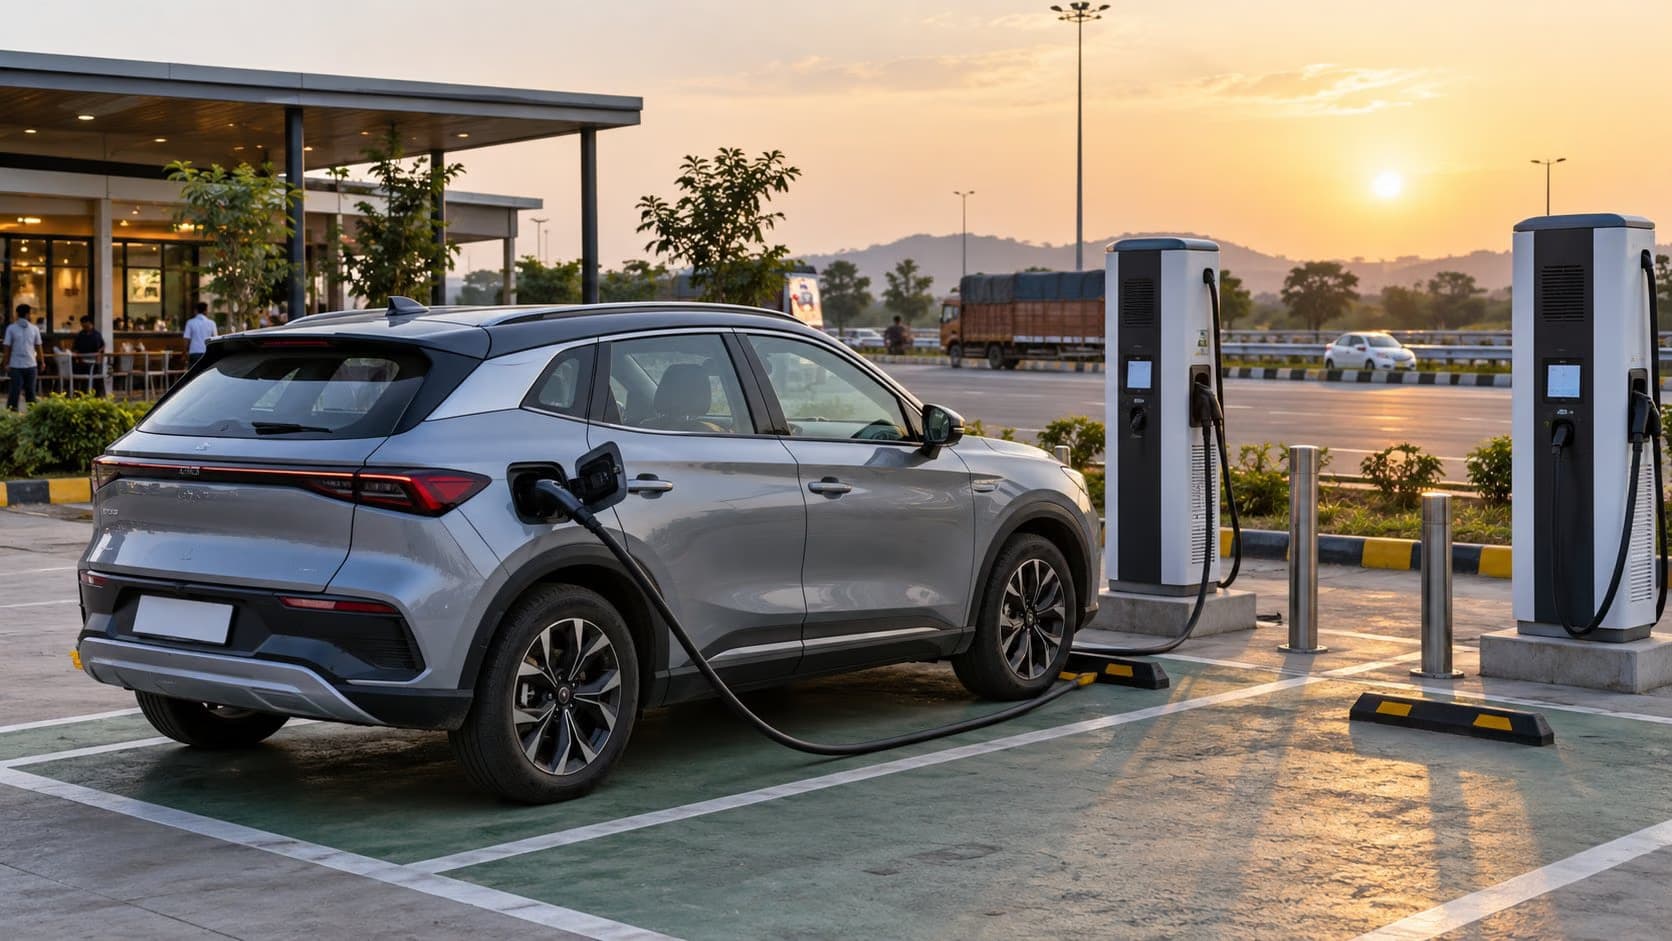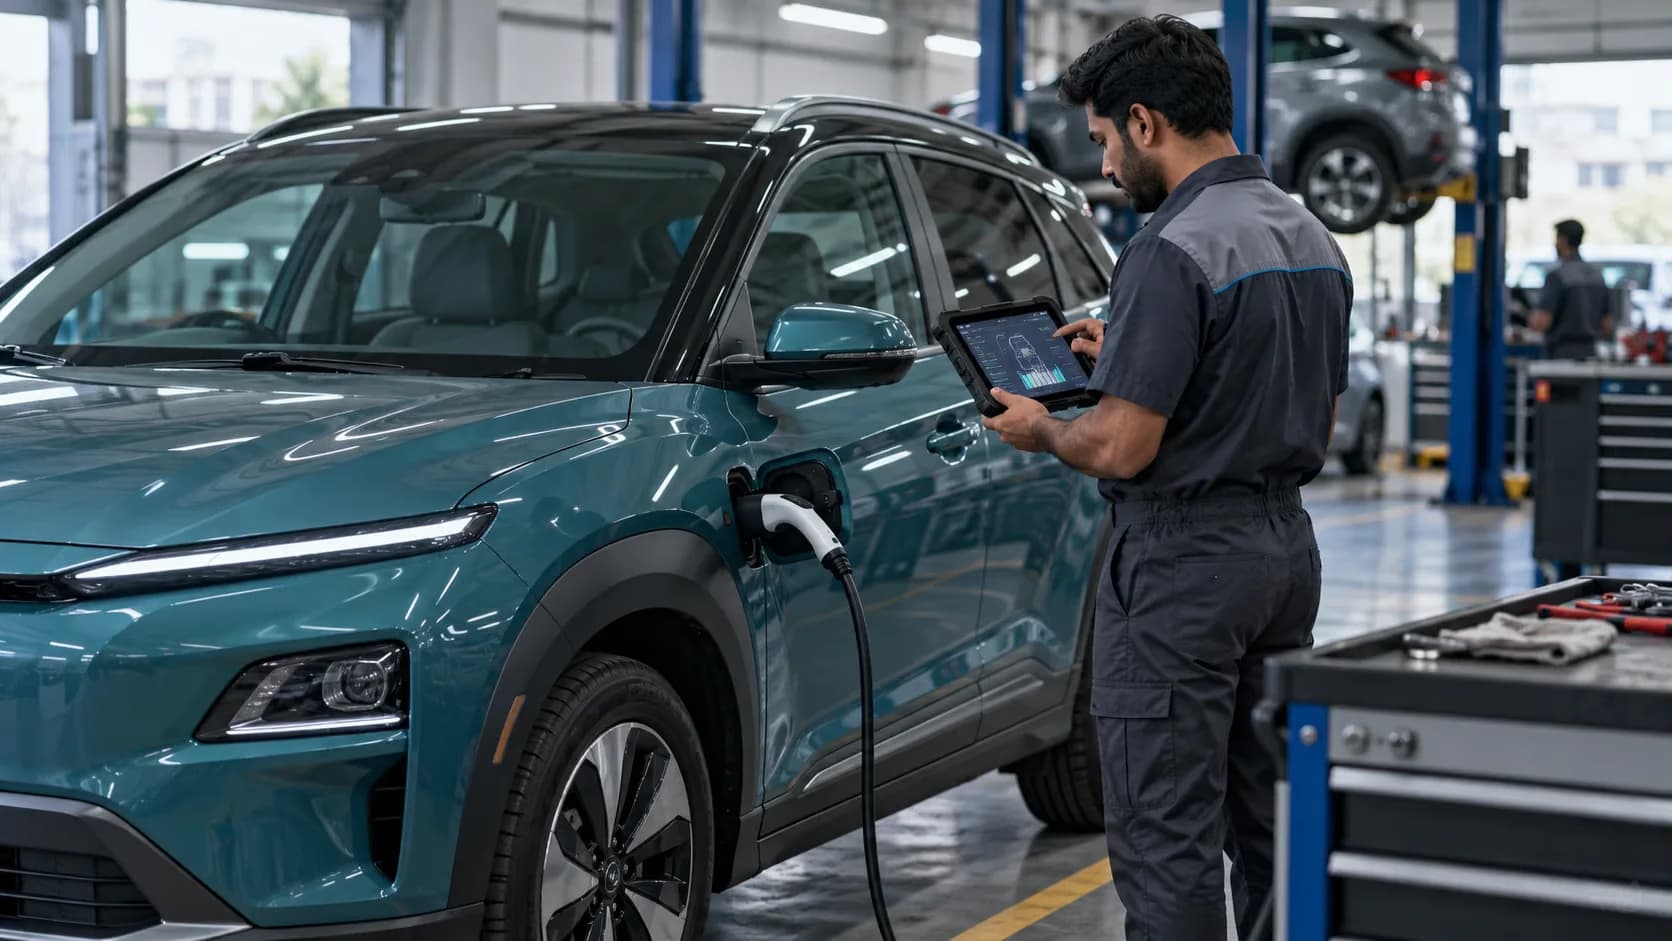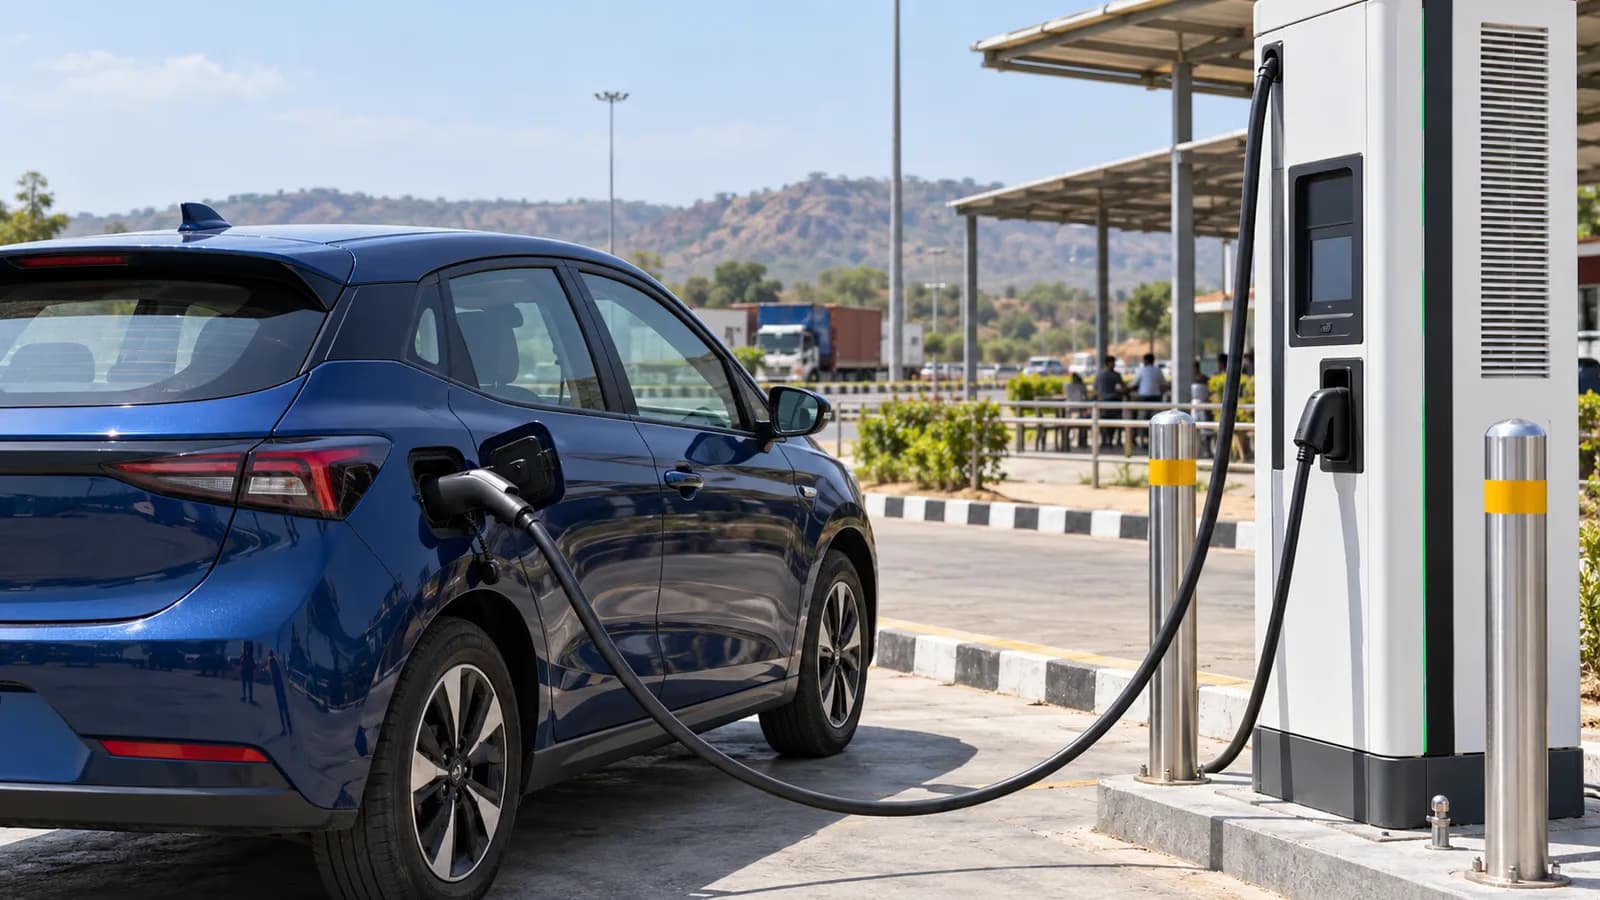
You arrive at a public charger marked 100 kW and your EV screen shows a lower number. It is tempting to declare the charger faulty. Sometimes it is. More often, the number on the cabinet describes a maximum capability while the actual session is negotiated between the charger and the car, subject to battery conditions and the station's current output.
This is different from choosing a compatible connector or working out the electricity bill. The question here is why charging power changes during a session, and how to judge whether the result is normal for your vehicle.
Three limits meet at the plug
The station has a rated power and may have site-level constraints. The car has its own maximum DC acceptance, which may be lower than the charger's rating. The battery-management system then adjusts the allowed power according to temperature, state of charge and other protection limits. The delivered value is bounded by the most restrictive condition at that moment.
A 100 kW charger does not turn a car with a lower DC acceptance capability into a 100 kW car. Conversely, a high-capability EV plugged into a lower-powered station cannot demand power the station cannot provide. Ask the manufacturer for the actual charging specification of the variant you plan to buy, not just the largest number in a marketing banner.
The charge curve is the useful picture
Charging power rarely remains at peak from empty to full. It may rise after connection, remain relatively strong over part of the battery's range, then taper as charge approaches the upper end. A US National Renewable Energy Laboratory charging study illustrates how power can vary with battery state of charge and vehicle type. Its example curves are not specifications for Indian models, but the shape explains why a short low-to-mid-charge stop can add energy faster than topping off the final percentage.
The number displayed at one instant is not the average for the whole session. To compare experiences, note the starting and ending charge percentages, energy added and total time. A peak value printed on a brochure tells less about a trip stop than a verified time over a defined charge window.
Temperature changes the answer
A hot or cold battery may be limited by the car's thermal controls. Some EVs precondition the pack when a compatible fast charger is selected in the vehicle's navigation; others use different logic. That subject deserves its own guide, but the practical point is simple: compare charging sessions at similar starting charge and conditions before blaming hardware. A station can be functioning normally while the car requests less power.
After a long drive in heat, active battery cooling may consume some energy and constrain charging. At a cold start in another region, the pack may need warming. The exact behaviour depends on the vehicle and should be checked in its official manual.
What the site can change
A charger may share power between connectors, be temporarily derated, or have a connector or cable fault. The operator's app may show station status but not always the precise reason a session is slower. If another available connector is safe and compatible, the operator may advise trying it. Do not unplug someone else's vehicle or handle damaged equipment. Report persistent faults with station ID, time and session details.
How to compare two EVs
- Look for manufacturer-stated DC charging times over the same percentage window, not just peak kW.
- Check the battery capacity and usable energy where published; percentage alone is not the same number of kilowatt-hours across cars.
- Read independent tests with disclosed weather, charger and starting charge conditions.
- Ask whether battery preconditioning is supported and how it is activated.
- Plan charging around sufficient trip reserve and available stations, not a theoretical peak that may last briefly.
Do not judge a model from one public charging attempt. A station issue and an unusually high starting charge can both produce a disappointing number. Record several comparable sessions before making a conclusion.
When to stop charging
For a journey, the best departure point is often when you have enough energy to reach the next reliable stop with a margin, not when the display says 100 percent. The upper part of the charge can take disproportionately long on many cars because the power tapers. Always follow the manufacturer's battery recommendations and your actual route needs. There is no universal percentage that fits every EV or trip.
The charger's sign is one part of the charging equation. The car's limit, charge curve, temperature and site operation determine the session. Understanding those pieces prevents unfairly blaming either the car or the network for a result that may be entirely normal.
Power is not energy
Charging power is expressed in kilowatts, while energy added is measured in kilowatt-hours. A charger showing 60 kW for a short period does not mean it added 60 kWh. As a rough illustration, 60 kW sustained for half an hour would amount to about 30 kWh before considering variation and losses. Real sessions seldom hold one power figure perfectly. Use the station receipt or car's energy-added reading to understand the stop, and compare billing rules separately.
Battery percentage is also not a fixed quantity across cars. Ten percentage points in a larger usable battery represents more energy than ten points in a smaller one. That is why two EVs may need different time to add the same percentage yet cover similar distances afterwards, or vice versa.
Arrival charge level can change the session
Starting a DC session at a high state of charge can put the car directly into the tapering part of its curve. The display may never approach the advertised peak. If another owner reports a much higher number, ask where their battery started and what charger they used. A lower starting charge is not always better for the trip, however: never arrive with so little reserve that an occupied or faulty station leaves you stranded.
Some charging curves have steps, short plateaus or abrupt drops. Those can reflect the vehicle's normal management logic. A single graph from another market or software version is not a promise for your car. Prefer manufacturer information for the exact variant and inspect your own session data over time.
Station power sharing and faults
A multi-connector station may divide site power when both dispensers are occupied. The operator may also temporarily reduce output because of heat or grid limitations. A damaged connector can interrupt charging or prevent a normal session. If power is unexpectedly low at several charge levels and temperatures, contact the operator with the connector ID and timestamps. If the pattern follows the car across different healthy stations, ask the vehicle service centre to examine it.
Do not diagnose solely from a photo of the charger cabinet. The operator's rated output, number of active plugs, car's negotiated limit and battery condition all need to be considered. Two identical charger cabinets can deliver different results on the same day if one shares power or has a fault.
Plan around time, not peak kW
For a road trip, ask how many minutes the car typically needs to move from a specified low charge to a useful departure charge on a compatible charger. Include the walk to the station, connection, app payment and possible queue. A nominally faster charger far off route may not save door-to-door time. A reliable lower-rated stop with food and facilities can be the better choice.
Keep enough reserve for an alternate charger and follow the vehicle's battery recommendations. Understanding a charge curve makes the charging stop less mysterious, but planning for a failed stop remains essential. The most useful number is the time it takes your car to add the energy your route needs.